
The data
By Alan Scott · Who makes this · Tijuana, Baja California ·
By Alan Scott · Who makes this · Tijuana, Baja California
Everything we publish in this site's articles comes from one dataset. Here it is in full, for download: the exact file we use ourselves, uncut, with nothing you need to ask us for.
The CSV
Download historico-garitas.csv · ~3.1 MB · 14,969 rows
| Column | What it holds |
|---|---|
fecha | Date, in YYYY-MM-DD format |
garita | San Ysidro, Otay Mesa, or Tecate |
carril | The lane within that port (car, SENTRI, pedestrian, commercial — whichever that port has) |
direccion | Always northbound, from Tijuana to San Diego |
minutos | That day's average, in minutes |
fuente | The full SANDAG citation, on every row |
Period: January 29, 2023 through August 9, 2026.
Granularity: one average per day. The public dataset has no hourly breakdown, and the CSV doesn't invent one either — the full explanation of why is in methodology (Spanish only for now).
The gap, shown rather than hidden: from March 27 through April 15, 2026, there is no record at all, at any port or lane. Instead of deleting those days or making up a number, the CSV carries 234 rows with date, port, and lane filled in, and minutos left blank — so the real gap is visible the moment you open the file, instead of silently disappearing.
The charts
The three charts that accompany the articles, available to download on their own:
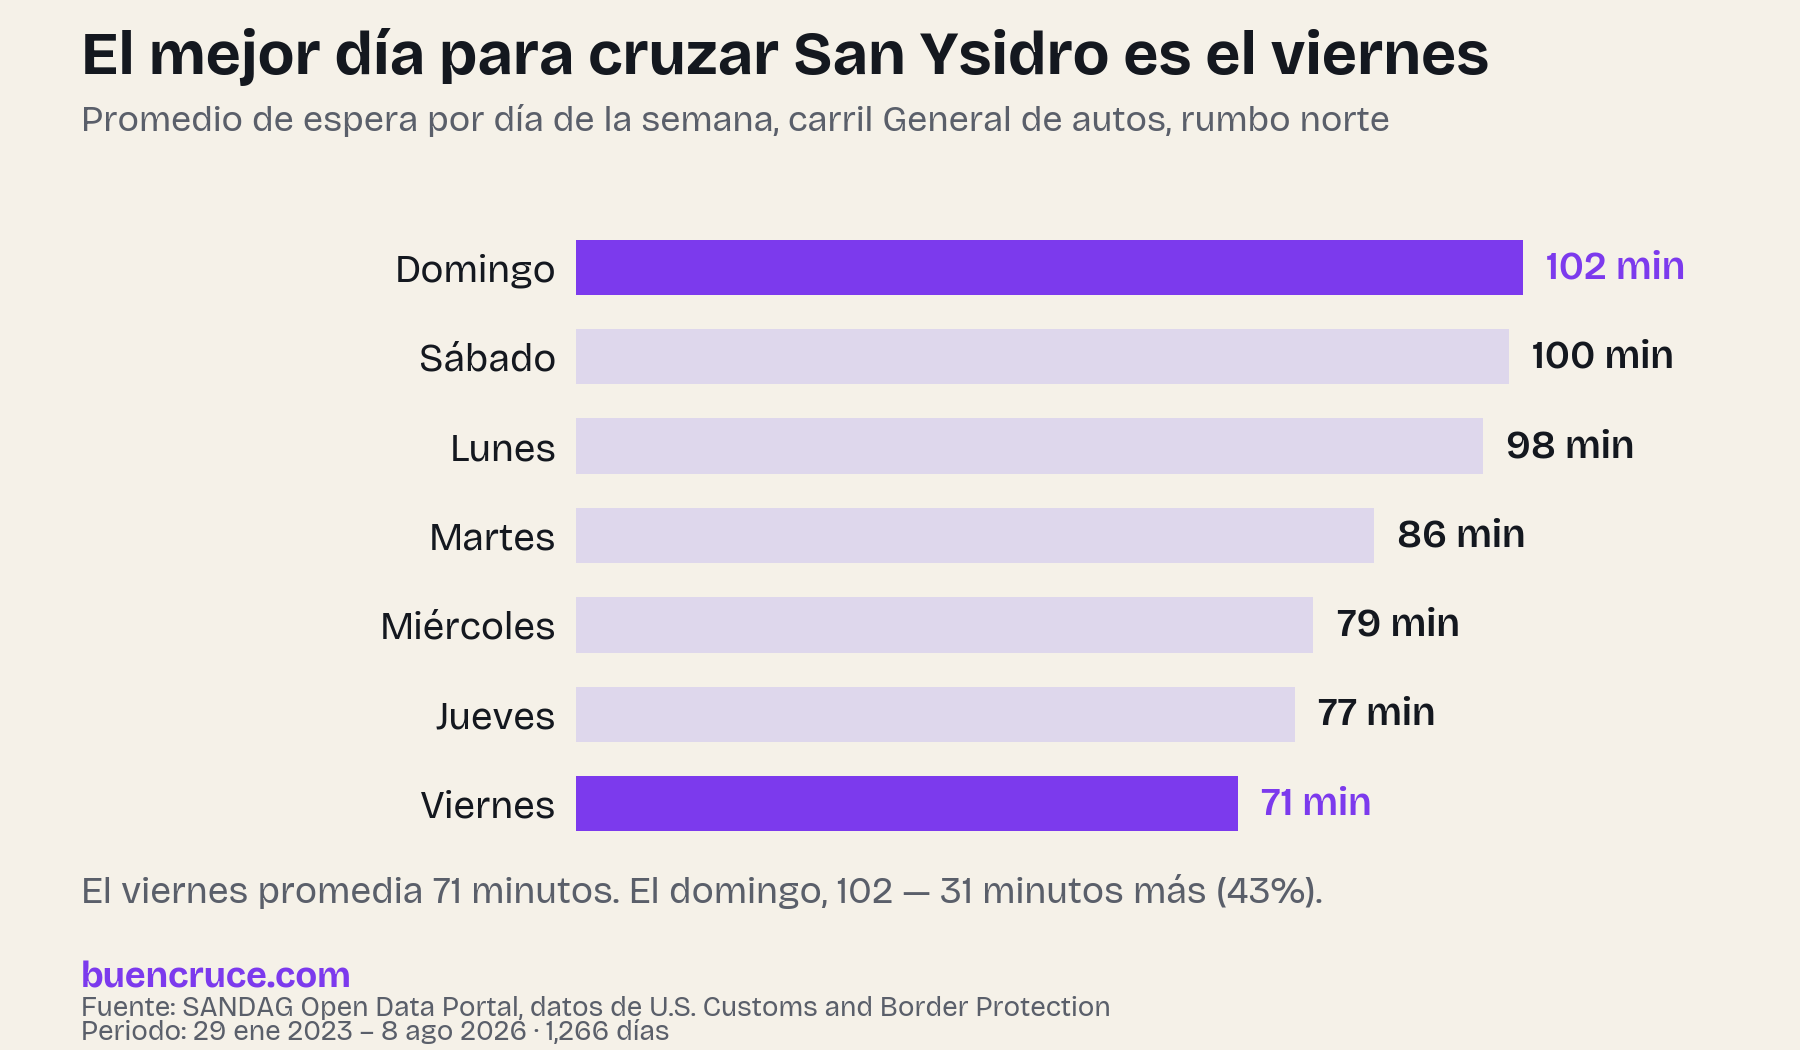
- The best day to cross — average by day of the week, San Ysidro General lane, northbound
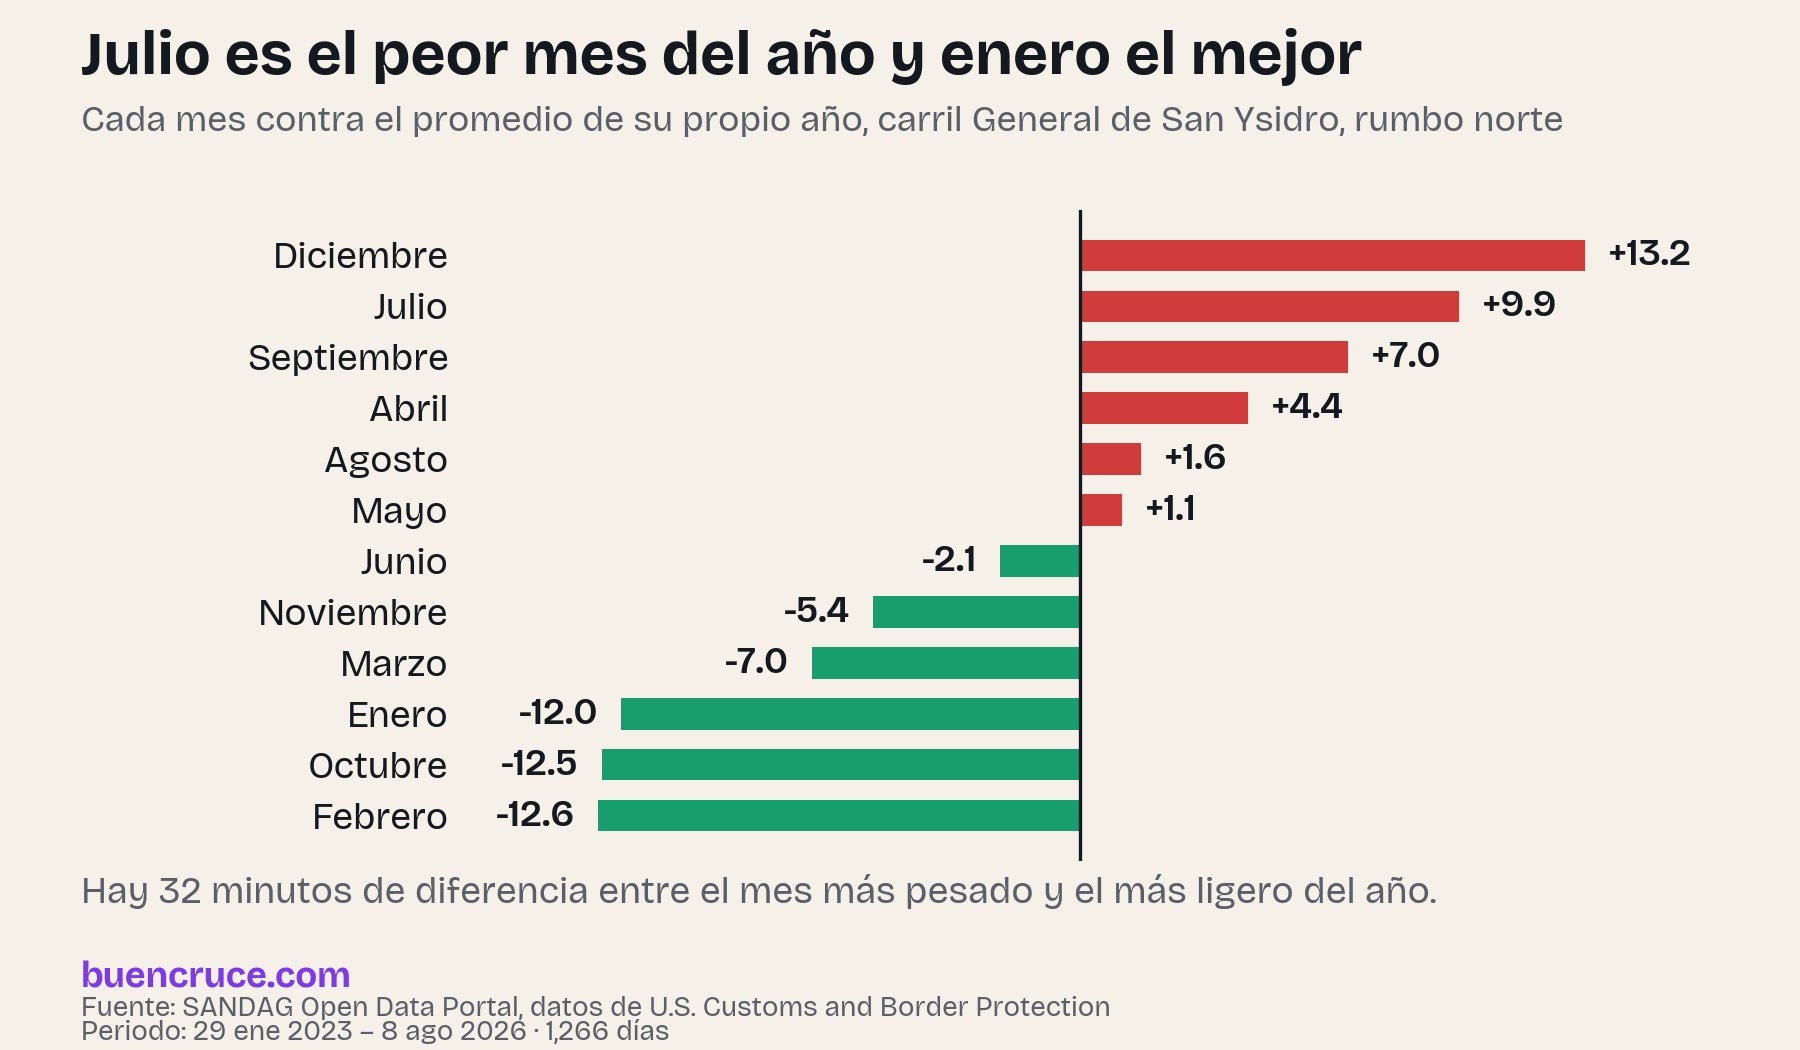
- The best and worst months — average by month of the year
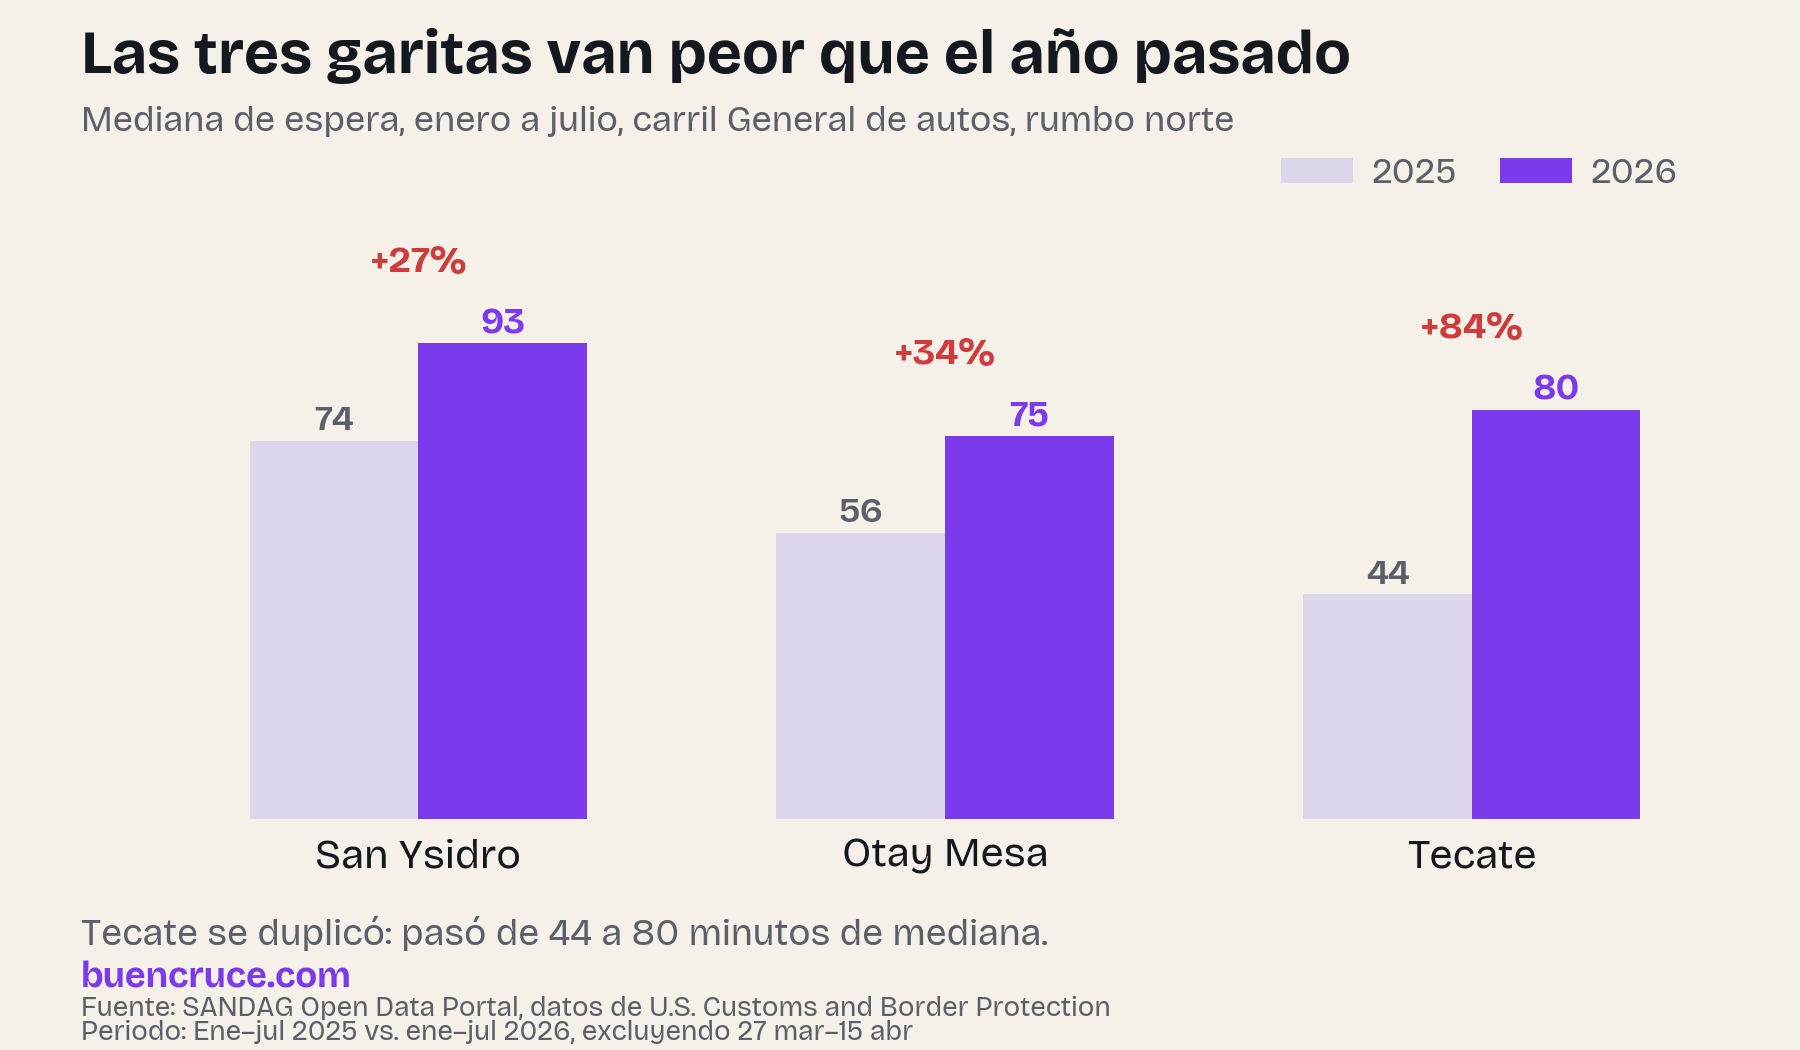
- How the line changed in 2026 — compared against the prior year
Where it comes from, and its license
The original measurement is CBP's (Customs and Border Protection), and it reaches us through Average Daily Border Waiting Time, the dataset published by SANDAG (San Diego Association of Governments). SANDAG lists it with "Use Limitations: None", meaning no usage limits are declared. On our side, you can use, cite, or republish this CSV without asking us first.
We are not affiliated with CBP or SANDAG. If you use it, we'd appreciate (not require) a credit to BuenCruce as the one who packaged it, alongside SANDAG as the one who published it.
The full explanation of how we process it — averages versus medians, what we compare and what we don't — is in methodology (Spanish only for now).
What this data is NOT
- It is not right-now's number. The one on the homepage updates on its own and is a different mechanism — explained in accuracy.
- It has no hourly detail, only daily averages.
- It is not a forecast. It's history: what already happened, not what's going to happen.
You might also want:
- Methodology (Spanish only for now)
- How often we get it right
- Who makes this